Graph Theory for the Representation of Metabolic Components
A graph is a mathematical representation that is very useful for illustrating and reasoning about complex objects composed of many smaller objects and the connections between them, for example a place map can be thought of as a graph, where the smaller objects are the towns and the connections are the roads leading from one town to another. Other applications of graphs include computer networks where each machine is connected to a set of other machines via network cables, and ecosystem energy flow diagrams where the connections illustrate the flow of energy between populations of species in the ecosystem.
Graphs are increasingly common in systems biology where they are used to model the metabolic pathways by which cells consume and construct the molecules necessary to sustain life and reproduce. Graphs allow an explicit representation of all the metabolic pathways, as well as the interactions between the pathways....
A graph G is an object composed of a set of vertices (or nodes) V and a set sof edges E connecting vertices from V, i.e. G = {V,E}.
for example...
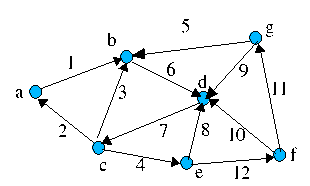
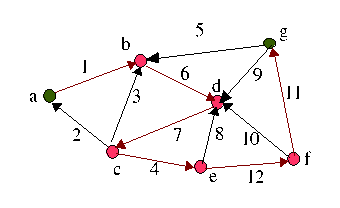
Where {a,b,c,d,e,f,g} are vertices and {1,2,3,4,5,6,7,8,9,10,11,12} are edges. This is an example of a directed graph, i.e. the edges denote "flow" in only one direction. It also contains cycles e.g. c -> b -> d -> c
A Path in a graph is a traversal from a start node to a destination node, with a note of each node (and sometimes edge) passed through on the way, for example...
Path P(a,g) = {a,b,d,c,e,f,g} (vertices) or {1,6,7,4,12,11} (edges)
A metabolic graph is a graph that is used to represent the chemical transformations that take place within the cell - many metabolic pathways are in fact graphs. Each vertex is a chemical compound (metabolite) and each edge represents a chemical transformation from one chemical to another.
Chemical transformations take place by means of chemical reactions, however transforming the set of reactions comprising a metabolic pathway into a (conventional) graph is not completely straightforward - more than a single edge is required to represent complex reactions involving more than two chemicals e.g
The (hypothetical) reaction
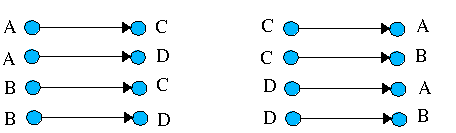
A + B <=> C + D (a reversible reaction)
gives rise to the following edges or chemical transformations
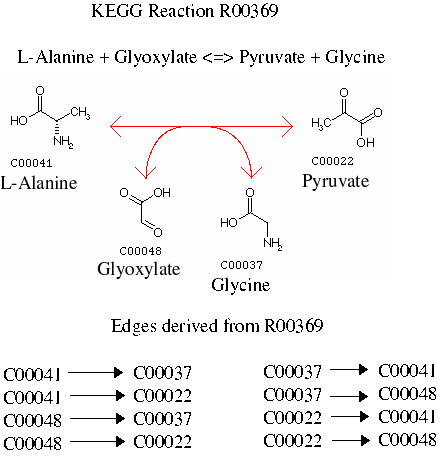
In a similar way the following reaction from KEGG also gives rise to eight unique edges...
These transformations do not always result in "meaningful" chemical transformations, e.g. in reactions involving cofactors such as NADP+, a chemical transformation such as Pyruvate -> NADP+ is not terribly meaningful because there is no transfer of electrons/atoms by which Pyruvate is converted into NADP+, - so the prescence of an edge in the graph is a little misleading. The pathway diagrams in KEGG are metabolic graphs in which the less meaningful chemical transformations have been removed, so that the focus is on the various transformations from the start points of the pathway to the end products, via the intermediary reactions.
In KEGG, and in the logical models used by the Robot Scientist all/most of the edges are annotated with the enzyme(s) that catalyse(s) the reaction(s) in which the chemical transformation takes place, and by the gene(s) or open reading frame(s) (ORFs) by which the organism synthesises the enzymes.
The logical models that have been used as background knowledge for the Robot Scientist(s) are logical representations of metabolic graphs. The Prolog computing language is used to represent the reactions and ORFs/Enzymes in the model.