Tropical Wetland Dynamics
Wetlands are important ecosystems for many reasons. Here at in the Earth Observation and Ecosystem Dynamics research group, we seek to monitor and understand tropical wetland dynamics so that we can conserve and protect these important habitats, quantify their role as both a source and sink of greenhouse gases, and improve the health and wellbeing of people living within tropical wetland ecosystems, particularly in relation to vector borne diseases like malaria.
Through collaboration with a number of partners across the World, we develop and deploy novel approaches for mapping inundation dynamics within wetland environments. To do this, we exploit signals from multiple sources of Earth Observation data:
![]()
Radar imagery can reveal information about water beneath grass and forest canopies. We use data from C-band and L-band radar systems to map inundation with grassland dominated floodplains and forested wetlands. Notably, our RadWet approach has been used to understand malaria risk in Zambia and map inundation dynamics over the entire Amazon Basin.
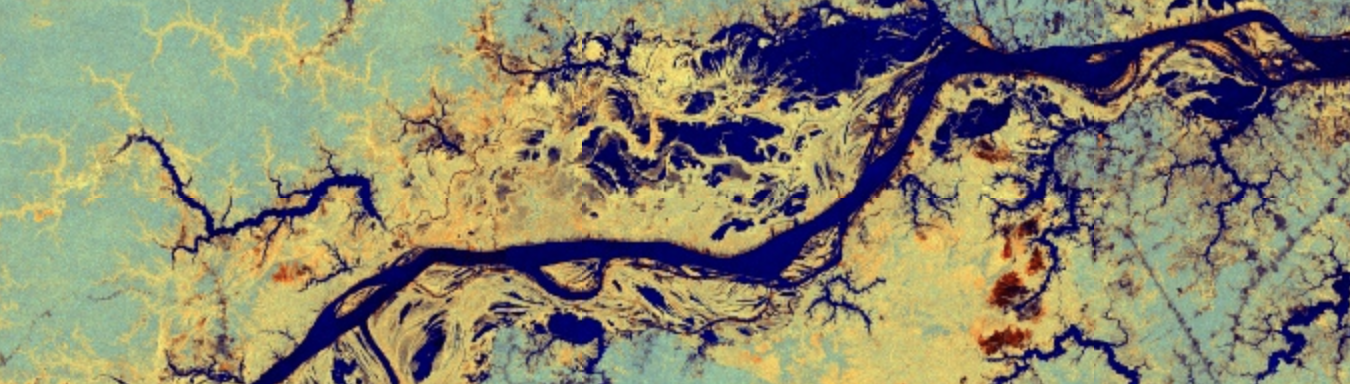 Yellow-orange colours depict flooded forest in this L-band radar image over the Central Amazon Basin.
![]()
Surface water and areas with a mix of water and vegetation can be distinctive in optical imagery, particularly in the near and shortwave infrared regions spectrum. Our TropWet approach exploits this signal by “unmixing” water, vegetation and bare soil. Alongside other variables, including hydrological terrain analysis, TropWet can be applied to sources of Earth Observation imagery like Landsat and MODIS to generate monthly inundation data at decadal timescales revealing unique insights into tropical wetland dynamics at a continental scale. Notably, TropWet has been used to reveal a significant increase in inundation extent in the Sudd Wetlands, South Sudan and provide wetland inventories across the Sahel Region of Africa.
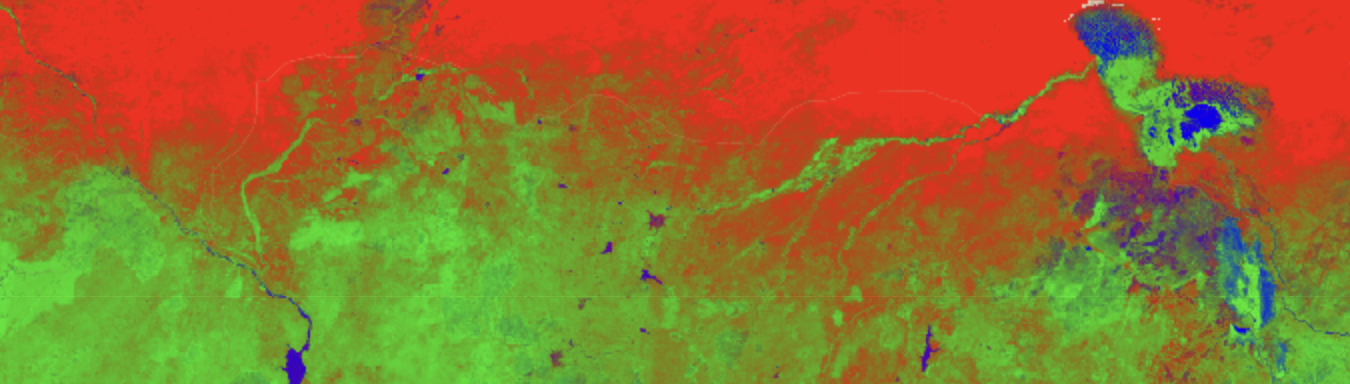 This “unmixed” MODIS image revealing areas of inundation (in blue) across Northern Nigeria, including Lake Chad to the East.
Saturated soils, surface water and vegetation with high water content mean that wetlands have a relatively low difference in day-night temperatures compared to dry land. As such, thermal imagery can reveal patterns of inundation. We are developing an approach that combines TropWet with diurnal thermal imagery from the MODIS system to provide timely maps of inundation over large scales. We plan to deploy this system across Africa, providing monthly inundation data from 2000-present and use this data to drive new estimates of greenhouse gas emissions from wetlands.
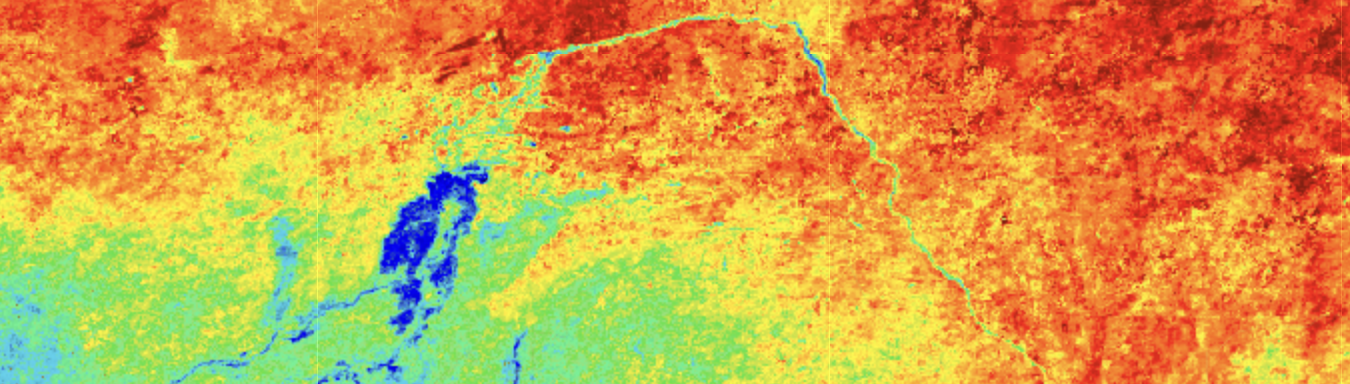
MODIS difference in day-night temperature indicating inundation (in blue) within the Inner Niger Delta.
Our partners include Wetlands International, SoloEO, Japanese Space Agency, Edinburgh University, the UK Centre for Ecology and Hydrology
Please contact Dr Andy Hardy (ajh13@aber.ac.uk) if you are interested in collaborating with us.
Selected Articles
RadWet: An Improved and Transferable Mapping of Open Water and Inundated Vegetation Using Sentinel-1. Oakes, G., Hardy, A. & Bunting, P., 22 Mar 2023, In: Remote Sensing. 15, 6, 30 p., 1705.
Tropical Wetland (TropWet) Mapping Tool: The Automatic Detection of Open and Vegetated Waterbodies in Google Earth Engine for Tropical Wetlands. Hardy, A., Oakes, G. & Ettritch, G., 07 Apr 2020, In: Remote Sensing. 12, 7, 24 p., 1182.
RadWet-L: A Novel Approach for Mapping of Inundation Dynamics of Forested Wetlands Using ALOS-2 PALSAR-2 L-Band Radar Imagery. Oakes, G., Hardy, A., Bunting, P. & Rosenqvist, A., 08 Jun 2024, In: Remote Sensing. 16, 12, 27 p., 2078.
Global Rice Paddy Inventory (GRPI): A High-Resolution Inventory of Methane Emissions From Rice Agriculture Based on Landsat Satellite Inundation Data. Chen, Z., Lin, H., Balasus, N., Hardy, A., East, J. D., Zhang, Y., Runkle, B. R. K., Hancock, S. E., Taylor, C. A., Du, X., Sander, B. O. & Jacob, D. J., 26 Apr 2025, In: Earths Future. 13, 4, 14 p., e2024EF005479.
Leveraging Earth observation data for surveillance of vector-borne diseases in changing environments. Fornace, K. M., Johnson, E., Moreno, M., Hardy, A. & Carrasco-Escobar, G., 2024, Planetary health approaches to understand and control vector-borne diseases. Brill Academic Publishers, Vol. 8. p. 319-346 28 p. (Ecology and Control of Vector-Borne Diseases).
Satellite data reveal how Sudd wetland dynamics are linked with globally-significant methane emissions. Hardy, A., Palmer, P. I. & Oakes, G., 13 Jul 2023, In: Environmental Research Letters. 18, 7, 12 p., 074044.
Hydrodynamic Modeling of Inundation Patterns of a Large African Floodplain Indicates Sensitivity to Waterway Restoration. Willis, T. D. M., Smith, M. W., Cross, D. E., Hardy, A. J., Ettrich, G. E., Malawo, H., Chalo, C., Sinkombo, M. & Thomas, C. J., 28 Nov 2022, In: Water Resources Research. 58, 11, 20 p., e2021WR030107.
Automatic Detection of Open and Vegetated Water Bodies Using Sentinel 1 to Map African Malaria Vector Mosquito Breeding Habitats. Hardy, A., Ettritch, G., Cross, D., Bunting, P., Liywalii , F., Sakala , J., Silumesii , A., Singini , D., Smith, M. W., Willis, T. & Thomas, C., 12 Mar 2019, In: Remote Sensing. 11, 5, p. 1-25 25 p., 593.